Risk Based Inspection
Proactive Precision, Confident Compliance: Elevate with Risk Based Inspection.Introduction to Risk-Based Inspection (RBI)
Risk-Based Inspection (RBI) is a systematic approach that focuses inspection efforts on equipment and piping systems facility, where the risk of failure due to active damage mechanisms is highest. The risk is assessed as a combination of the probability of failure (POF) and the consequence of failure (COF).
Benefits of RBI
Implementing an RBI approach provides several advantages.
Reliability and Compliance
Ensures adherence to applicable codes and standards.
Risk Reduction
Enhances awareness of potential risks for plant operators.
Deteriorating Equipment Management
Facilitates the identification of equipment requiring repair or replacement.
Extended Asset Life
Promotes better asset management to increase the longevity of plant and equipment.
Optimized Inspection Scheduling
Enables cost-effective inspection techniques and schedules.
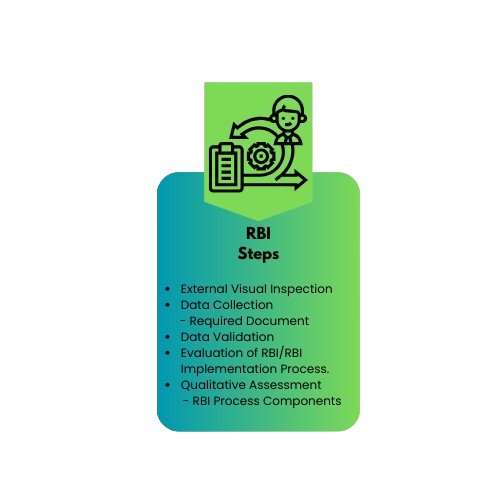
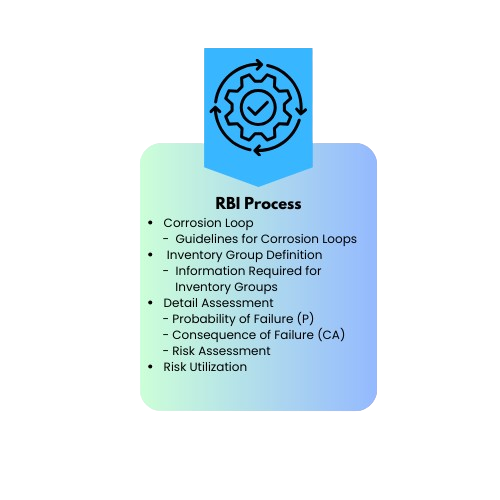
RBI Steps
External Visual Inspections
Perform external visual inspections to evaluate the following:
• Condition of piping
• Insulation systems
• Painting and coating systems
Purpose: Identify signs of misalignment, vibration, and leakage.
Data Collection
RBI studies require collecting a significant amount of data to identify essential information. Data gathering should begin as soon as possible, ideally before or immediately after the kickoff meeting.
Required Document
Prior to the RBI assessment, a desktop study will be conducted using the following documents (not limited to):
- Process flow diagrams (with flow and mass balances)
- Piping and Instrumentation Diagrams (P&IDs).
- Design and operational data (temperature and pressure)
- Equipment and piping specifications
- Fluid compositions
- Materials of construction and fabrication
- Design assumptions and information
- Equipment data sheets, U1 forms, and General Arrangement drawings
- Past inspection records
- Repair and modification records
- Coating and insulation specifications
- Estimated costs (repair costs, repair time, production loss costs)
- Environmental cleanup costs
- Injury costs
- Population density information
- Heat Material Balance (HMB)
- Inspection and maintenance reports for all tanks and piping (both internal and external)
- Operational data history trends (temperature and pressure)
- Design calculations (wall thickness)
- Operating manuals
This collected data will serve as the foundation for data entry into the RBI project within PALADIO Software.
Evaluation of RBI/RBI Implementation Process.
The qualitative assessment approach relies on descriptive information, using engineering judgment and expertise to analyse the probability and consequence of failure.
- In cases where there is a discrepancy between measured data and actual process data, or when detailed quantitative data is lacking, this analysis will help complete the risk assessment.
- The accuracy of qualitative analysis results is contingent upon the background and expertise of the analysts involved.
- This qualitative process will be conducted in close collaboration with relevant company personnel, including SSIE, Process Engineering, and Reliability
Qualitative Assessment
RBI systematically identifies, assesses, and maps industrial risks, such as corrosion and stress cracking, that can compromise the integrity of pressurized equipment and structural elements.
RBI Process Components
RBI supports:
- Storage of all technical and inspection data
- Utilization of algorithms for quantitative RBI evaluation
- Development of detailed inspection plans
- Management of inspections in alignment with plant activities
- Quick analysis of the risk status of equipment
- Provision of appropriate mitigation actions based on analysis.
RBI Process
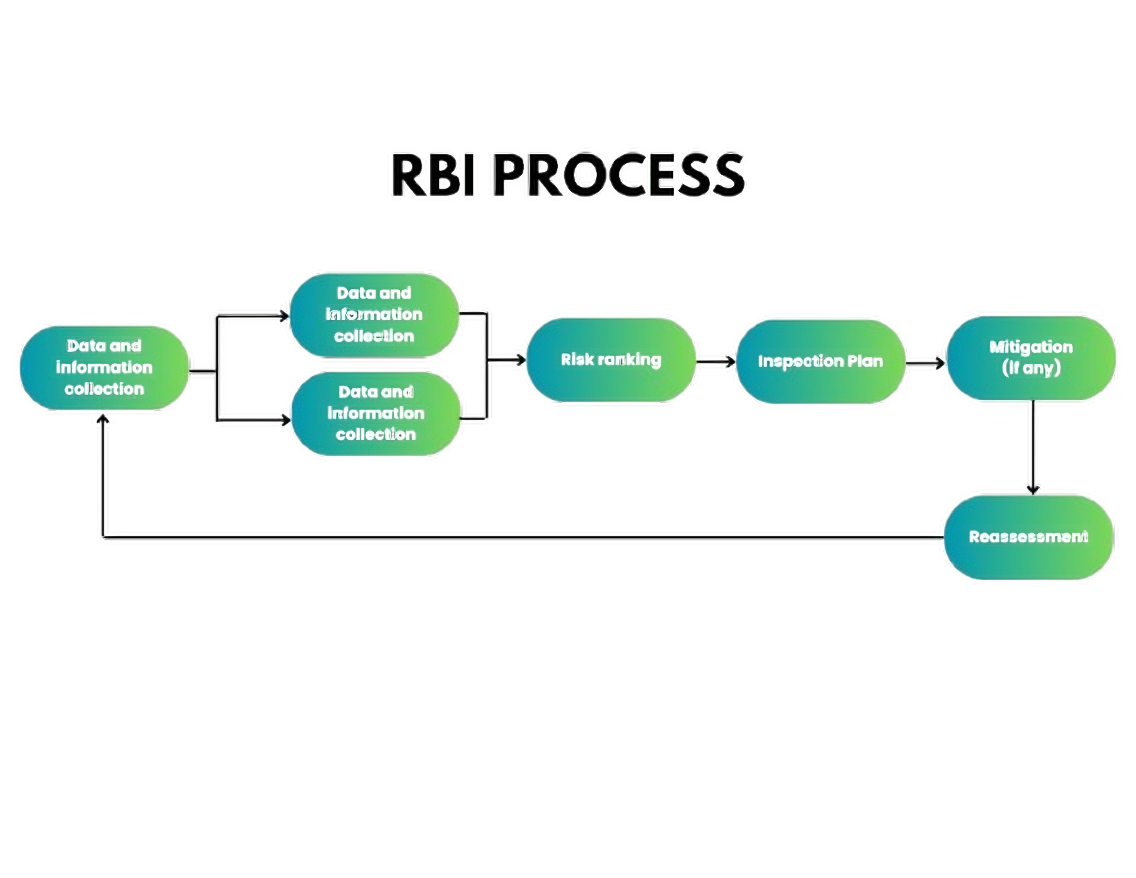
The RBI methodology is a proactive approach that enhances asset integrity management by focusing resources on high-risk areas. Through effective data collection, validation, qualitative assessment, and continuous monitoring, organisations can optimise their inspection programs, reduce risks, and extend the life of their assets.
Corrosion Loop
Corrosion loops consist of piping groups that are identified on Process Flow Diagrams (PFDs) and Piping and Instrumentation Diagrams (P&IDs) according to specific guidelines. These guidelines ensure that the piping systems grouped together share similar characteristics, enhancing the accuracy of corrosion assessments and maintenance strategies.
Guidelines for Corrosion Loops
Corrosion loops are marked based on the following criteria:
- Piping Class and Metallurgy: Grouped lines must have the same piping class and material composition.
- Operating Conditions: Grouped lines should operate under similar conditions (temperature, pressure).
- Effluent Composition: Grouped lines must contain the same effluent with similar proportions of
contaminants (e.g., CO2, H2S) and water. - Protection Systems: Grouped lines must have identical external and internal protections (e.g., thermal
insulation, heat tracing, internal linings). - Corrosion Prevention Systems: Grouped lines must be protected by the same corrosion prevention
measures (e.g., corrosion inhibition, dehydration, deoxygenation). - Erosion Sensitivity: Grouped lines should be equally sensitive to erosion, particularly for velocities
exceeding 4.5 m/s. - Corrosive Environments: Grouped lines must be exposed to identical specific corrosive environments (e.g., vibrations, areas particularly exposed to elements, hot cyclic service).
Inventory Group Definition
Inventory groups are identified on PFDs or P&IDs to delineate small-scale system boundaries. This categorisation is critical for quantifying the amount released in the event of a Loss of Primary Containment (LOPC), leakage, or equipment failure.
Information Required for Inventory Groups
To effectively calculate inventory groups, the following essential information is necessary:
- Operating conditions (temperature, pressure)
- Process stream characteristics
- Fluid contaminants and their concentrations
Detail Assessment
Probability of Failure (P)
The probability of failure is quantitatively calculated by analysing all potential damage mechanisms in compliance with API 581 standards. This involves assessing historical data, environmental conditions, and material degradation processes.
Consequence of Failure (CA)
The consequence of failure is evaluated by considering the type of fluid involved. This assessment accounts for:
- Flammable Consequences: Potential impacts of fire or explosion.
- Toxic Consequences: Effects on health and safety due to toxic releases.
- Non-Flammable/Non-Toxic Consequences: Environmental and operational impacts.
The final outcome of this evaluation yields a value termed the “Final Consequence Area.”
Risk Assessment
Risk is defined as the combination of likelihood and consequence, formulated as follows:
- Likelihood Analysis: Based on equipment history and operational data, the probability and effects of specific failure mechanisms are assessed.
- Consequence Analysis: Evaluate the impact of failure concerning safety, environmental, and economic losses.
The combined evaluation of likelihood and consequences produces an estimate of risk for each equipment item. This risk assessment informs the allocation of inspection and maintenance planning, enabling the identification of high-risk areas that require immediate attention. In contrast, low-risk areas may be scheduled for preventive maintenance.

Risk Utilization
The estimated risk can be used as a basis for determining inspection effectiveness. For potentially high-risk areas, appropriate actions will be taken, including mapping and mitigation strategies, followed by immediate tasks such as:
- Shorter inspection intervals
- More effective inspection methods
Conversely, for potentially low-risk areas, the exact mapping and mitigation processes will be applied, but with:
- Longer inspection intervals
- Less intensive inspection methods
Influencing Variables
The variables that influence risk include:
- The time since the last inspection for each damage mechanism
- The effectiveness of the inspection for each damage mechanism
Defining a limit risk value (Risk Target) that should not be exceeded is essential.
Inspection Planning
- Inspection activities can be categorised as follows:
The inspection plan should detail the unmitigated risk associated with current operations. - For unacceptable risks, the plan must include recommended mitigation actions to reduce the unmitigated risk to an acceptable level.
- For equipment items where inspection is a cost-effective risk management means, the plan should describe the type, scope, and timing of inspections.
- For equipment ranked as “LOW RISK,” the inspection strategy may follow company-standard intervals or adhere to established engineering practices such as API 653 and API 510.
- If the risk at the time of the RBI assessment exceeds the Risk Target, it is recommended that the inspection be performed immediately.
- If the risk at the time of the RBI assessment is less than the Risk Target and it is determined that the risk limit will not be reached before the planned date, no inspection is recommended.
Reporting
Upon completion of the RBI assessment, the report will be reviewed, edited, and finalized. BV will ensure that the Inspection Record Summary, Corrosion Loop, and Risk Matrix generated during the study are included as part of the report.
The Inspection Report Summary will allow for the management of the reports and maintenance activities, outlining both short-term and long-term actions.


